Drivers of Excess Mortality
Non-COVID excess deaths appeared in 2020 during the pandemic and increased again in 2021. What is driving it?
Edward Dowd’s interview on Steve Bannon’s War Room program discussing excess deaths during the pandemic has gotten quite a bit of attention. Wall Street is now paying attention as Life Insurance companies report significant higher mortality than their actuaries expected, and people are looking for answers.
So, what killed so many more people than expected in 2020 and 2021. Clearly, COVID was unexpected but what about the increase in non-COVID deaths? Where did they come from? In this post I will focus on 2020. I will dive into 2021 in a future post.
To set the table for this analysis, see the graph below from my prior post where I confirmed Edward Dowd’s exhibits. This graph presents excess death percentage increase for ages 25-44 split by COVID (orange) and non-COVID (blue). My focus in the post will be explaining the non-COVID excess deaths included in the red circle. (I will explain in a minute while I won’t be able to extend it to the end of 2021 when I look at that year, at least, not yet)
How Deaths are Defined
In order to understand why deaths unrelated to COVID increased in 2020, we have to dive into what killed people? In order to do that, we need to understand how deaths are reported in the United States.
States are responsible for gathering deaths certificates, which is the source of CDC’s mortality data. Every state captures cause of the death the same way. On the death certificate, there is a place to enter the underlying cause of death and there is also a place to enter any other conditions that may have contributed to the death. There will always be only one underlying cause on each death certificate but there can be up to twenty contributing causes.
The convention that is used to enter cause of death is the International Statistical Classification of Diseases and Related Health Problems or ICD code. This is from the CDC technical note:
Mortality statistics are compiled in accordance with World Health Organization (WHO) regulations specifying that WHO member nations classify, and code causes of death with the current revision of the International Statistical Classification of Diseases and Related Health Problems (ICD). ICD provides the basic guidance used in virtually all countries to code and classify causes of death. It provides not only disease, injury, and poisoning categories but also the rules used to select the single underlying cause of death for tabulation from the several diagnoses that may be reported on a single death certificate, as well as definitions, tabulation lists, the format of the death certificate, and regulations on use of the classification.
The ICD codes have up to ten digits that get more specific as you add digits. Below, I have included a table of ICD codes (3 digits) with their definitions.
As I mentioned, for this analysis, I am focused on non-COVID deaths. Here is how I am defining a non-COVID death. I use this definition because it is consistent with the CDC definition.
The ICD code for COVID is U07.1. Therefore, I am looking at all deaths that have an ICD code in the Underlying cause other than U07.1. However, I am also excluding any death that has the COVID code in the “multi” line even if it has a non-COVID as underlying. This is because the CDC defines a death as COVID if it is in either the underlying or multi lines regardless the underlying cause.
This means, for example, you could have a drug overdose as the underlying cause but if COVID is listed in the multi field, CDC counts it has a COVID death. Such deaths appear to represent around 10% of COVID deaths, although that varies over time and depending how you cut the data. [Update 2: All good. Data re-reconciled. Analysis holds]
The reason I am using that definition for the non-COVID analysis is so that I can reconcile my data to a known source. In a future post, I will be diving into COVID deaths, including those with a non-COVID underlying cause.
CDC ICD Data Considerations
When looking at CDC data by ICD code, it is important to understand a couple of things in order to use the data correctly. The first is that there are certain code categories that are reported on a 6-month lag. As we will see, some of those categories are big drivers of excess non-COVID deaths and that is why when I do look at 2021, I will have to stop halfway through. Those deaths are coded with an ICD beginning with “9” and later reclassified to the correct code.
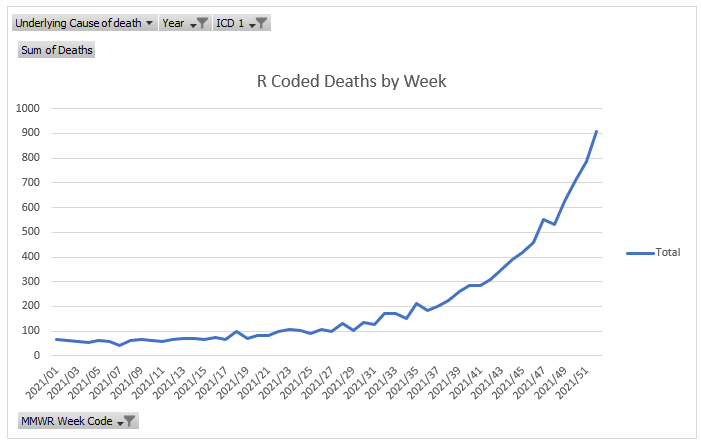
The other thing to remember is that data changes over time as deaths get reclassified. That is true for the categories mentioned above as they get reassigned from the “9” group but also for “R” codes. “R” codes are basically unknown or strange causes and tend to spike up in more recent periods as deaths are reported. The graph below shows R coded deaths for 2021. See the spike in the latter part of the year? That will flatten in the next six months as unknown deaths are defined.
Ok. After all that, I am ready to get to the data. As I mentioned, in this post, I am going to focus on 2020.
Completion and Base Line
In order to look at the data by cause, I had to pull from the CDC Wonder System for Multi-Cause Deaths. Recall in my last post, I mentioned that I had found a CDC data set that was both “weighted” (meaning it had estimates for more recent periods) and included a base line in order to measure excess deaths. Neither of those things is in the CDC Wonder system.
What that means is that I need to make sure the data is complete. That’s not a problem since I am only looking at 2020, which has had plenty of time to complete. However, I also need to develop a baseline. What I did was compared excess deaths using the CDC data from my original post to a proxy of excess deaths in 2020 by assuming 2019 as a base line. It actually works pretty well. Here is a comparison of 2020 non-COVID total excess deaths using each method.
2020 Excess Deaths by ICD Category
So, now I am ready to compare deaths in 2020 to 2019 by ICD to see where the excess deaths are coming from. All that I have to do is see what ICD categories increase in 2020 compared to 2019.
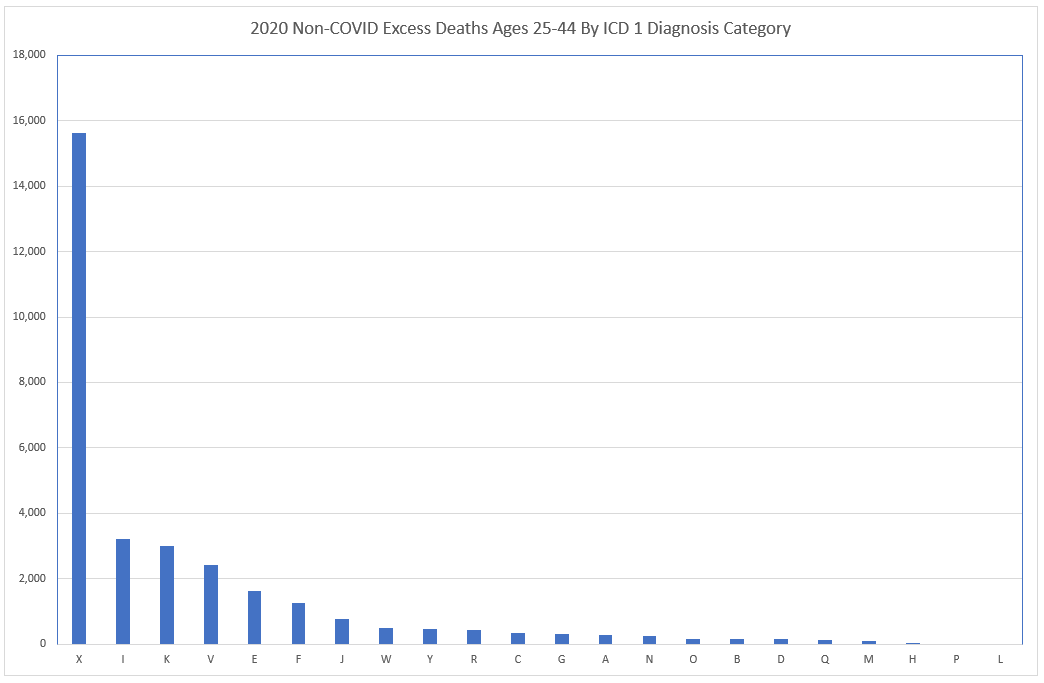
Below is a chart that shows the 31,134 excess death in 2020 for non-COVID causes by ICD 1 code. That is to say, I use the first digit of the ICD code.
Excess deaths for each code are simply the total for 2020 for that code minus the total for 2019. You can use the table of codes above to see what each one is, however, I will provide more specifics below. The chart here has the biggest drivers on the left and then descends as we move right.
What you see is that half of the excess deaths are in the “X” code category (the first column on the left). Note, “X” is one of the categories on a six month lag that initially gets a “9” code so right now, data is only available through week 35 of 2021. The ICD table above lumps that in the range of V01-Y89 (External Cause of Morbidity and Mortality” so let’s get more specific. Here is a breakdown of the X codes by three-digit ICD so we can see specifically what the drivers are. There are more X codes but I have limited to these top codes since they represent 99% of the excess deaths associated with this category.
So basically, drugs, alcohol and guns. This is actually not surprising as it has been known for a while that drug overdoses spiked during the pandemic. For example, see here. The firearm discharges are interesting and could be investigated further by looking at results by state.
It is also helpful to look at this by week. Here is the chart for total deaths for the “X” category by week.
I have added blue vertical lines to show the year change. What is clear is that the deaths start to rise at the beginning of the pandemic in March of 2020. Also notice that the deaths tick up in the first part of 2021 for this category, which is part of the reason we see deaths tick up again for this age group in 2021, which is mentioned in the article linked above. I will have more to say about non-COVID deaths in 2021 in a future post.
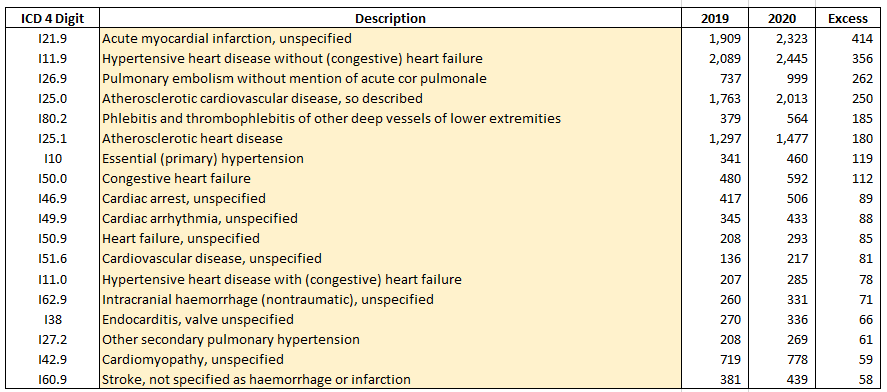
The “I” codes are the second biggest category. This is stuff related to the cardiovascular system. Think heart problems. Note, this is 2020 so before vaccines so something else going on here. The codes below represent 75% of the excess deaths in 2020 due to “I” codes. I suspect this has to do with shutting down the health care system except for COVID but that is just a guess.
Here are the 75% of the “K”s. Alcoholism.
The “V”s are car accidents. The “E”s are diabetes and obesity. “F”s is mental health issues but associate with drugs and alcohol.
Those are the big drivers.
Summary
So now we know what drove non-COVID deaths in 2020. But realize this. What this means is that non-COVID deaths for age 25-44 in 2020 were 3.5 times the number of COVID deaths for that age group. Here are the numbers
Let me say that again. Non-covid causes killed 3.5 times as many people age 25-44 in 2020 than COVID did. When you look at the causes above, it is clear that these must be associated with the public policy response, primarily the lockdowns, and that is supported by the timing in the X chart.
The defenders of the public policy responses might argue that COVID deaths would have been higher if the lockdowns had not been put in place so comparing non-COVID deaths to COVID deaths is not appropriate. But more and more that argument doesn’t hold water. It is becoming clear (and many are starting to admit) that the lockdowns did nothing to reduce COVID deaths.
What those lockdowns did do was kill a whole lot of people.
Next time, I will dive into 2021 as well as discuss what is happening in some other age groups.


Excellently and clearly communicated. This post reads like a winning courtroom argument for No Lockdowns a la Perry Mason, you had me hooked through each explanation and chart. Thank you for helping us clearly see the collateral damage done and giving us the data support to go to our elected officials if lockdowns are mandated or proposed again. It's immoral and criminal that the CDC isn't using or analyzing their own data, they are culpable.
Excellent writeup. Looking forward to 2021 numbers.